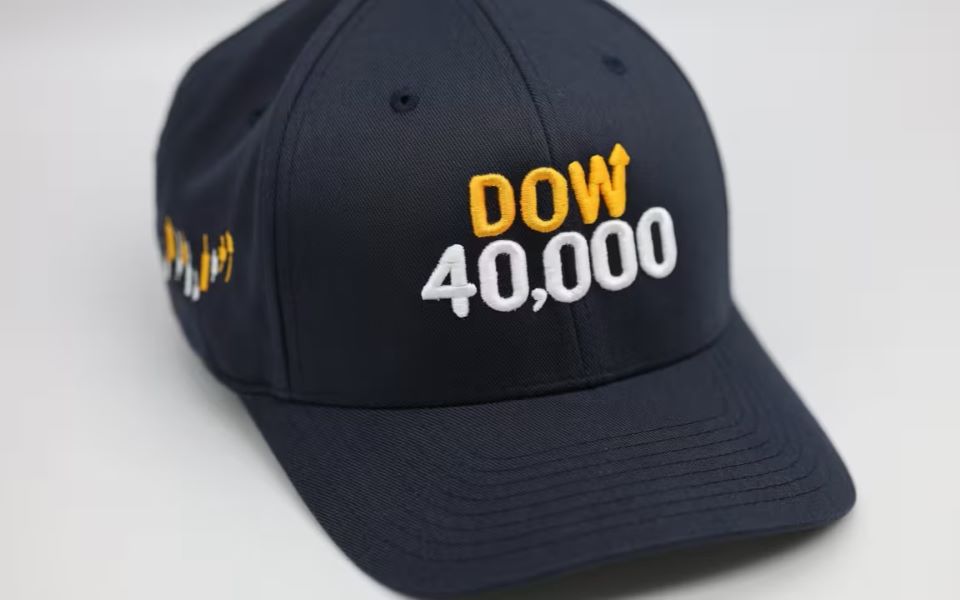
Dow 40,000

The S&P 500 gained 4.8% in May, offsetting the 4.2% dip in April. Year-to-date the S&P 500 is up over 11% while the Bloomberg US Aggregate Bond Index continues to struggle, down about 1%.
The Dow Jones Industrial Average made history on May 17th, closing at over 40,000 for the first time. The index soared 2,300 points on its way through 40,000, but has since plummeted 1,400 points from the peak. The numbers are dramatic, but it’s important to put them in perspective. Another way to describe this year so far is that the Dow rose 6% to start (still very good!) then pulled back about 3.5%. It is up about 2.5% year to date now.
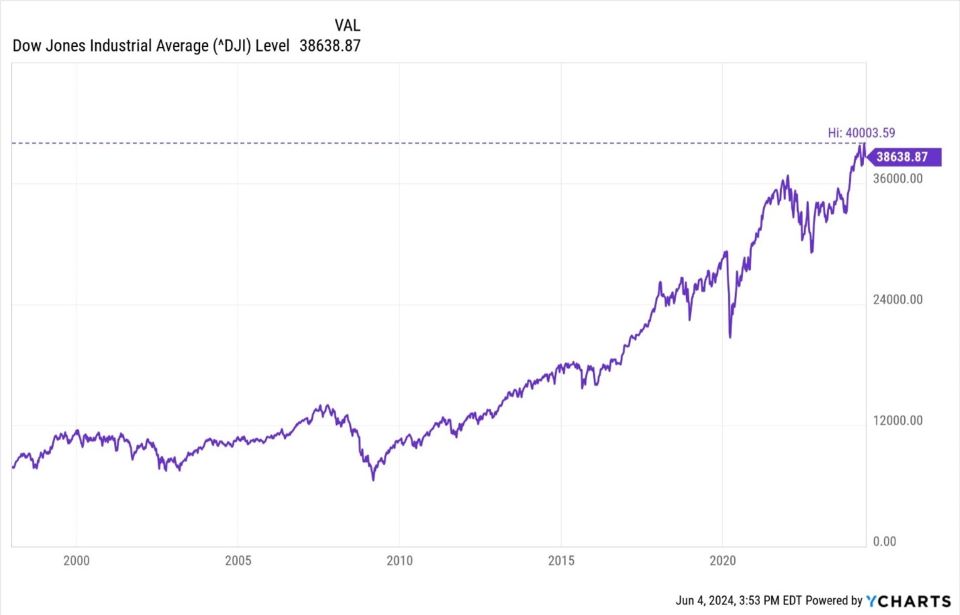
When the Dow hits a milestone like 40,000, it’s good to reframe what “points” mean. Coming out of the financial crisis in 2009, the Dow was at 10,000 and a 100 point move in one day was 1%, a relatively big move. Today that same 100 points is 0.25% and a 1% move is 400 points. The Dow bounced around that 10,000 range for about a decade prior to breaking out post-crisis so many market-watchers are anchored to that level. As a result, 100 points can still feel like a big deal even though it represents a smaller percentage move today.
Market Commentary Disclosures
Fairway Wealth Management LLC (“Fairway”) is an SEC Registered Investment Adviser. Registration does not imply an endorsement of the firm by securities regulators nor does it indicate that the adviser has attained a particular level of skill or ability.
This post represents the opinions of Fairway as of the date indicated and may contain forward-looking statements, predictions and forecasts. Forward-looking statements necessarily involve risks and uncertainties, and undue reliance should not be placed on them. There can be no assurance that forward-looking statements will prove to be accurate, and actual results and future events could differ materially from those anticipated in such statements. Past performance is no guarantee of future results. Market conditions can vary widely over time and can result in a loss of portfolio value.
This post is prepared using third-party sources. Fairway considers these sources to be reliable; however, it cannot guarantee the accuracy or completeness of the information received. This information is educational and general in nature and is not intended to be, nor should it be construed as specific investment, tax, or legal advice. Charts are provided for the illustrative purpose of general market commentary. No client or prospective client should assume the above information serves as the receipt of, or substitute for, personalized individual advice.